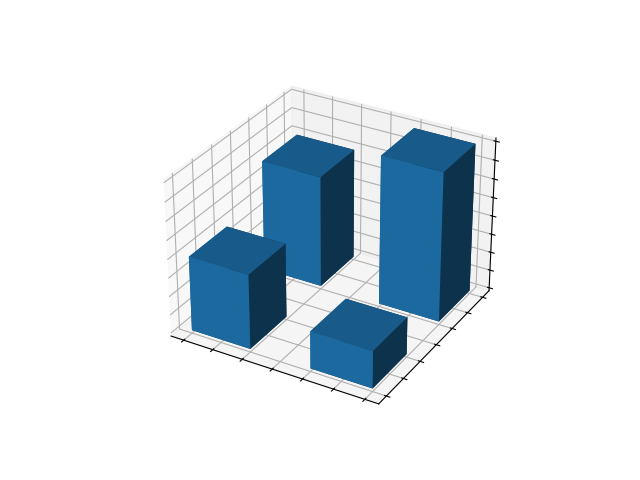
3D bars
import matplotlib.pyplot as plt
import numpy as np

x = [1, 1, 2, 2]
y = [1, 2, 1, 2]
z = [0, 0, 0, 0]
dx = np.ones_like(x)*0.5
dy = np.ones_like(x)*0.5
dz = [2, 3, 1, 4]

# Plot
fig, ax = plt.subplots(subplot_kw={"projection": "3d"})
ax.bar3d(x, y, z, dx, dy, dz)

ax.set(xticklabels=[],
       yticklabels=[],
       zticklabels=[])

#plt.show()
plt.savefig('3dbars.png')