Matplotlib Simple Pie
import matplotlib.pyplot as plt
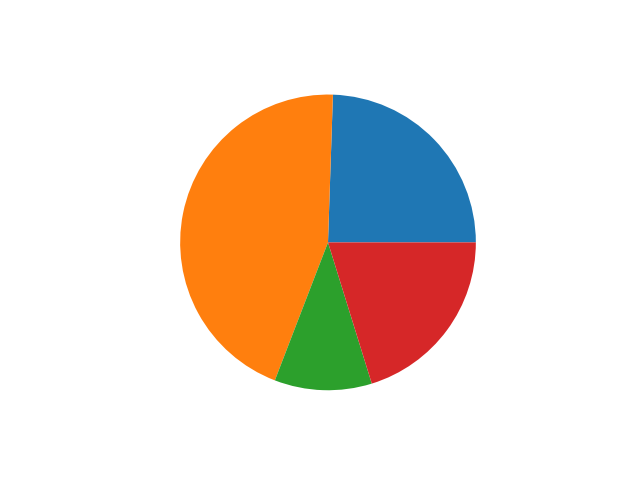
wedge_sizes = [ 23, 42, 10, 19 ]
plt.pie(wedge_sizes)
plt.show()
#plt.savefig('simple_pie.png')
The number in the array represent the ratio of the areas. They do NOT have to add up to a 100.
documentation of matplotlib.pyplot.pie