Bar
import matplotlib.pyplot as plt
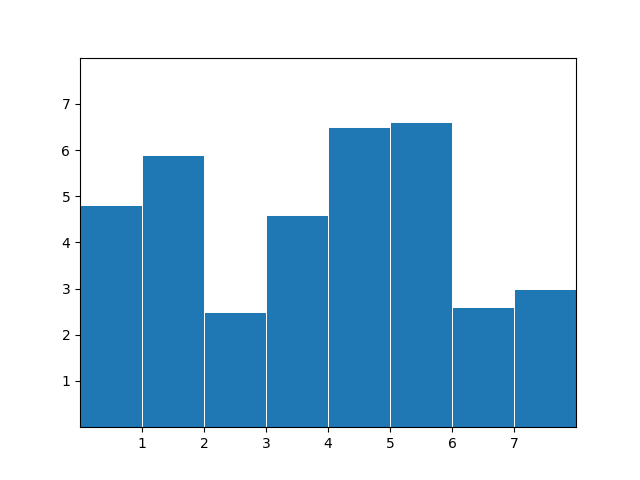
x = [0.5, 1.5, 2.5, 3.5, 4.5, 5.5, 6.5, 7.5]
y = [4.8, 5.9, 2.5, 4.6, 6.5, 6.6, 2.6, 3.0]
fig, ax = plt.subplots()
ax.bar(x, y, width=1, edgecolor="white", linewidth=0.7)
ax.set(xlim=(0, 8), xticks=range(1, 8),
ylim=(0, 8), yticks=range(1, 8))
#plt.show()
plt.savefig('bars.png')