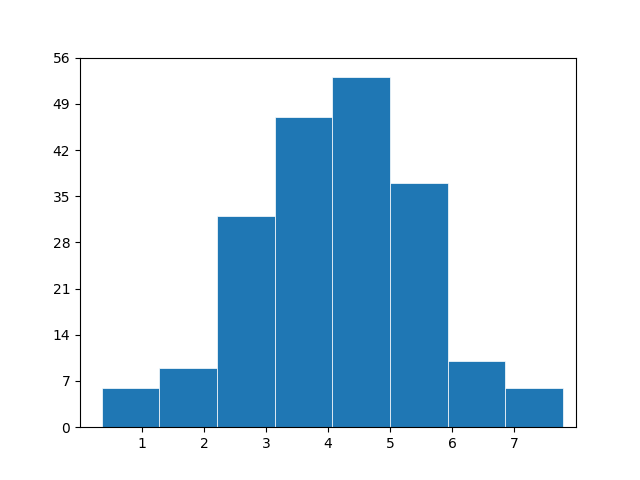
Histogram
- histogram (to group the values into bins)
import matplotlib.pyplot as plt
import numpy as np

np.random.seed(1)
x = 4 + np.random.normal(0, 1.5, 200)

# plot:
fig, ax = plt.subplots()

ax.hist(x, bins=8, linewidth=0.5, edgecolor="white")

ax.set(xlim=(0, 8), xticks=range(1, 8),
       ylim=(0, 56), yticks=np.linspace(0, 56, 9))

#plt.show()
plt.savefig('histogram.png')