Line with formatting
import matplotlib.pyplot as plt
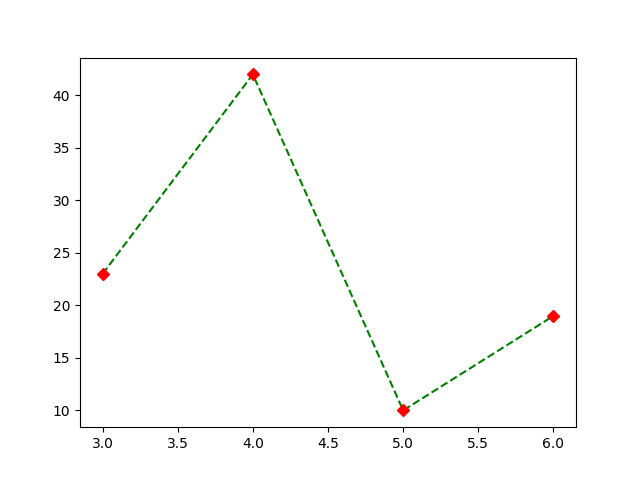
x = [ 3, 4, 5, 6 ]
y = [ 23, 42, 10, 19 ]
#plt.plot(x, y, "b-") # blue solid line
#plt.plot(x, y, "ro") # red circles
#plt.plot(x, y, "gx") # green x-es
plt.plot(x, y, "g--") # green dashed line
plt.plot(x, y, "rD") # red diamonds
#plt.show()
plt.savefig('line_with_formatting.png')
See the documentation of plot for a listing of styles.