Line with labels (xlabel, ylabel)
import matplotlib.pyplot as plt
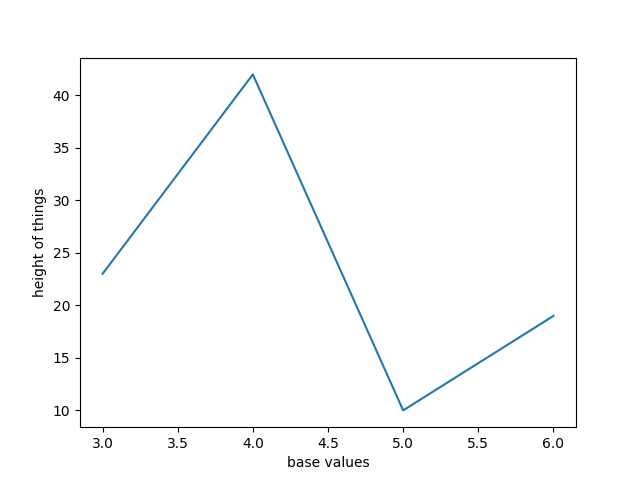
x = [ 3, 4, 5, 6 ]
y = [ 23, 42, 10, 19 ]
plt.plot(x, y)
plt.ylabel("height of things")
plt.xlabel("base values")
plt.show()
#plt.savefig('line_with_labels.png')
documentation of matplotlib.pyplot.plot