Matplotlib Line
import matplotlib.pyplot as plt
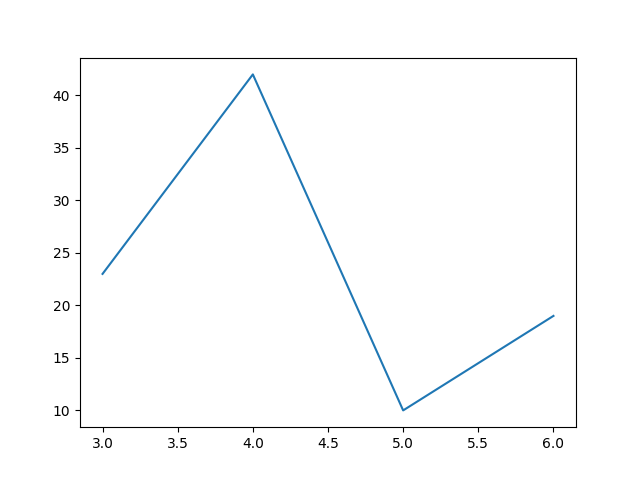
x = [ 3, 4, 5, 6 ]
y = [ 23, 42, 10, 19 ]
plt.plot(x, y)
plt.show()
#plt.savefig('line.png')
The numbers in the two lists are the values of the x and y axis respectively.
documentation of matplotlib.pyplot.plot