Line: y only
import matplotlib.pyplot as plt
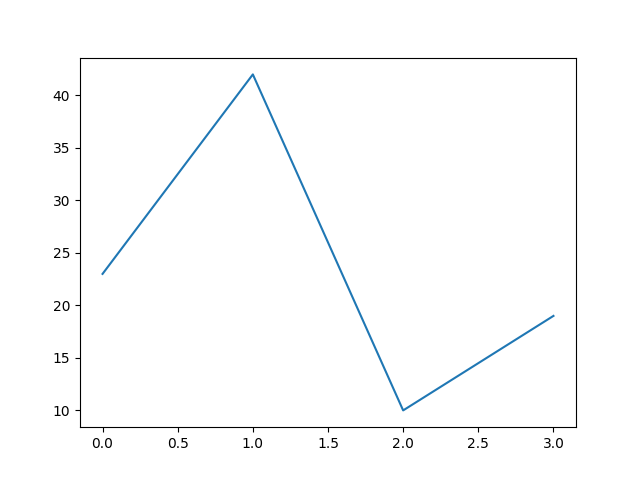
y = [ 23, 42, 10, 19 ]
plt.plot(y)
plt.show()
#plt.savefig('plot-y.png')
The numbers in the lists are the values of the y axis.
The x axis defaults to the numbers 0, 1, 2, … as is needed.
Press ← or → to navigate between chapters
Press S or / to search in the book
Press ? to show this help
Press Esc to hide this help
import matplotlib.pyplot as plt
y = [ 23, 42, 10, 19 ]
plt.plot(y)
plt.show()
#plt.savefig('plot-y.png')
The numbers in the lists are the values of the y axis.
The x axis defaults to the numbers 0, 1, 2, … as is needed.